
When you are dealing with applications which handle a massive amount of data and high traffic, performance is usually a critical issue to deal, and consequently, the ability to identify any bottleneck in your software may be precious. I’d like to share here some insights about profiling in PHP applications, it means, how to analyse your app and try to improve its performance through the data gathered.
I had the idea to write about profiling after seeing a talk about in the last PHP Experience from Thiago Rodrigues and its talk about this subject.
My sample
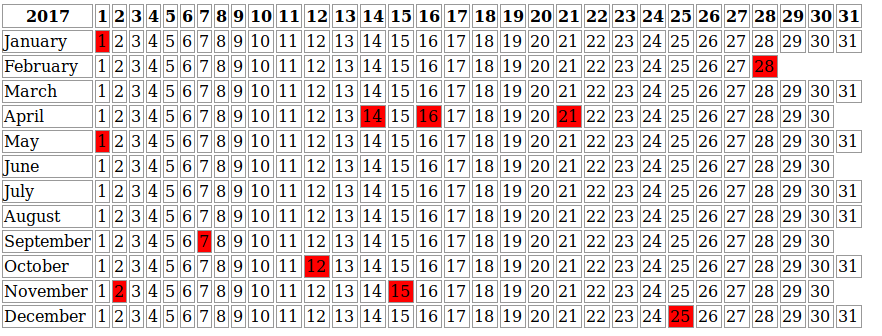
I’ve created a simple application which shows the holidays for a country using the HolidayAPI, my aim here is to Xdebug profiler in action. This application should retrieve the data from this API using HTTP requests and show a really simple calendar like you can see below, I repeated this calendar 20 times with the holidays of a given country, in my case, Brazil. You can see the code here.
Configuring Xdebug
As you may know, Xdebug is an excellent tool for debugging, but few people use it as a profiler, and in fact, is not a hard task to do. You can enable the profile to generate data in every application call or using a trigger parameter XDEBUG_PROFILE in this case, using a Cookie or HTTP param request.
xdebug.profiler_enable=1
xdebug.profiler_enable_trigger=0
xdebug.profiler_enable=0
xdebug.profiler_enable_trigger=1
The files generate usually have as the name cachegrind.out plus the PID and are stored in the /tmp directory, both file and directory are possible to be changed int the Xdebug configuration file.
How to visualize and analyse the data?
That’s an easy task to do, once you have generated the cachegrind.out there are a few possibilities and tools to show and analyse it; the BlackFire.io is nowadays the profiler tool with more resources, but unfortunately, if you want to use it in your company is not free, so my focus here will be two open source tools and how to see the data in PHP Storm.
PHP Storm
It’s pretty easy to see the data in the PHP Storm IDE, but maybe you might have a few problems if you are using the latest Xdebug version (2.6 at this moment) with old PHP Storm versions, the parser probably won’t be possible to generate the information from the cachegrind files. Personally, I have this problem.
The shortcut to show data on PHP Storm is Tools -> Analyse Xdebug Profiler Snapshot and select the cachegrind file localization, as I said above, it is usually saved in the tmp directory.
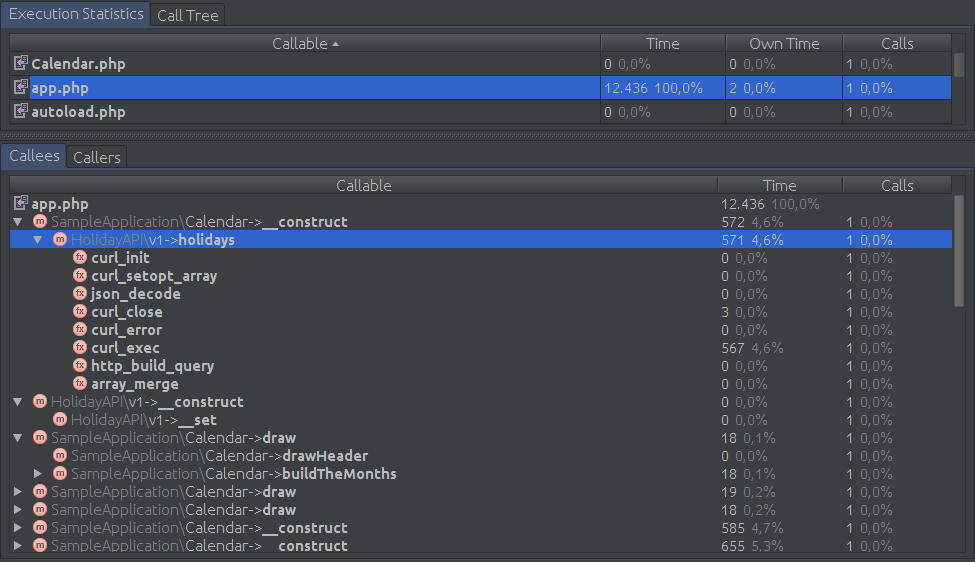
Showing the data of the calendar application on PHP Storm
Webgrind and KCacheGrind
Webgrind and KCacheGrind are tools that allow us to have more information of the cachegrind files, for instance, you can generate charts and see in a better way all the application flow and how each part is related to the other. Both are alternative to the BlackFire.
The following images you can see the information generated of the same calendar application.
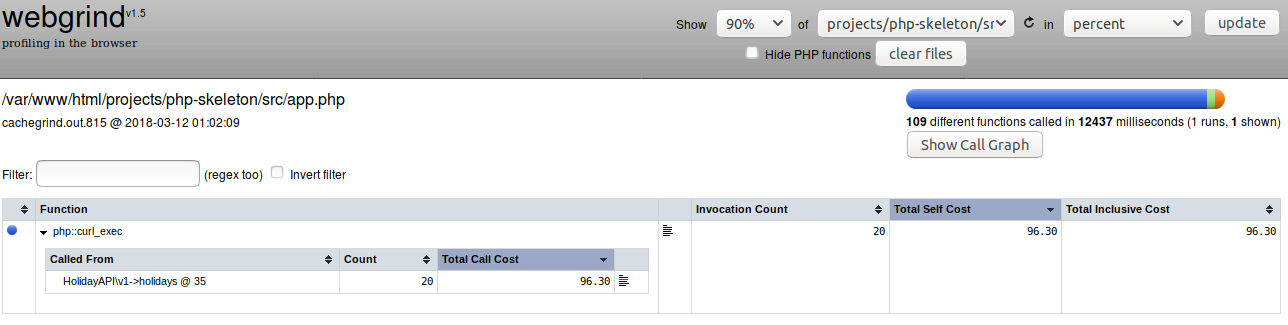
Webgrind dashboard
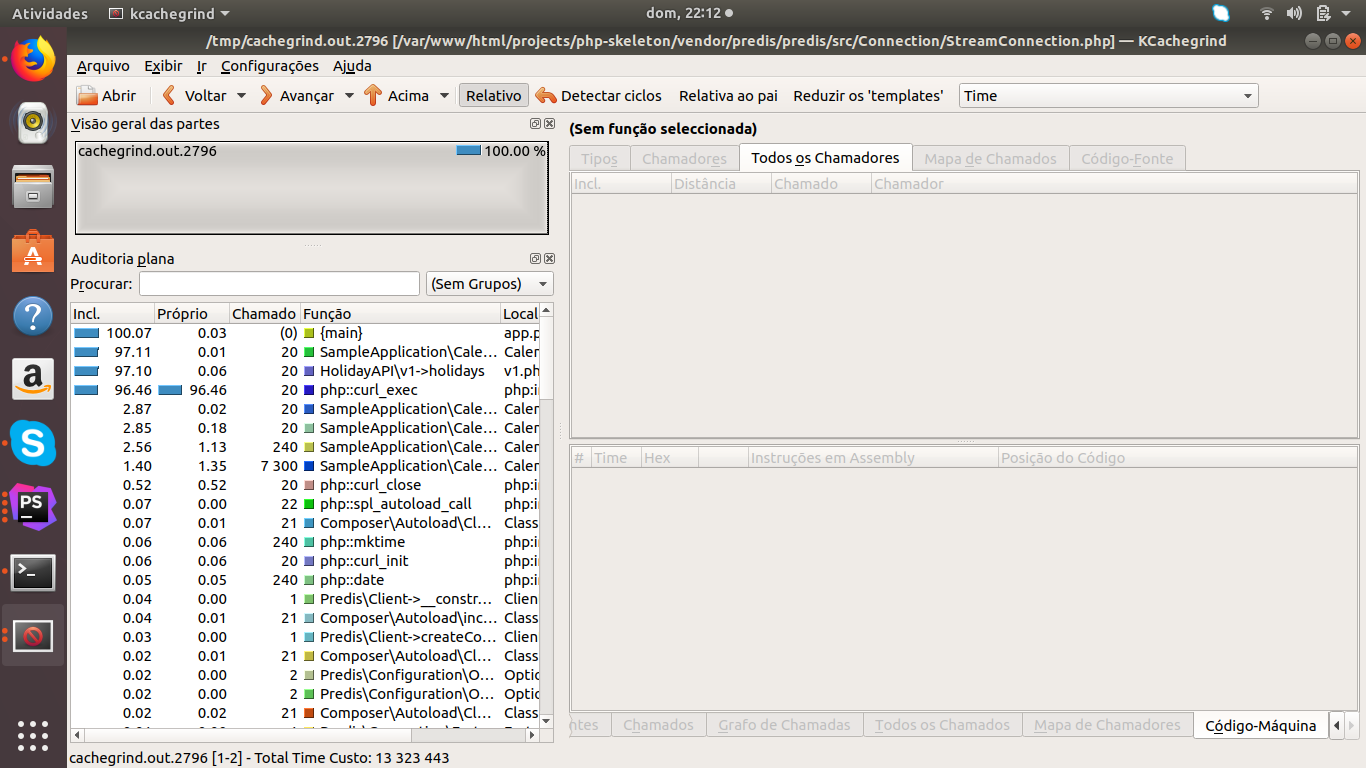
KCacheGrind showing results with more details
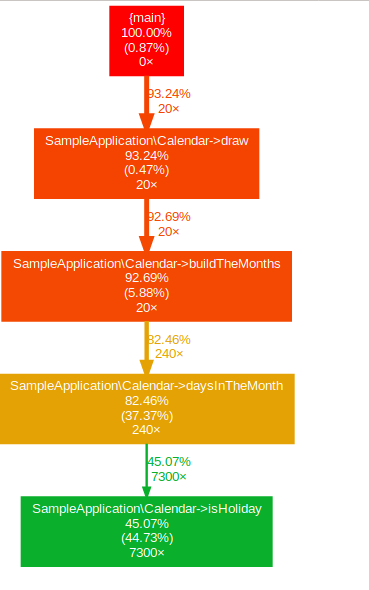
WebGrind chart showing the application flow
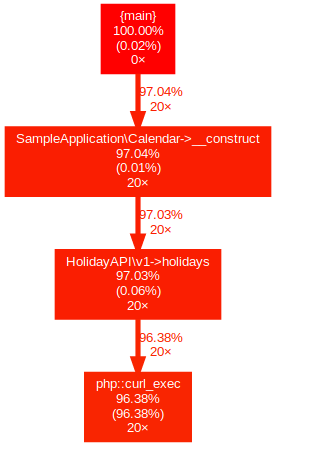
As you can see on all the data analysed using PHP Storm, KCacheGrind and WebGrind, the HTTP request with Curl took more time to be executed; it is typical externals requests like to databases or APIs spending more time than the rest of the application because those depend on external things. For instance, in real applications, it would be the first point to optimise, maybe using a cache layer with Redis to avoid the same requests being done many and many times in an unnecessary way, is unlikely that this data will change in the future.
I’m going to add a cache layer with Redis to improve the performance; it goes without saying that there are other approaches to give it a go, but in our case, the cache is enough.
The application with cache.
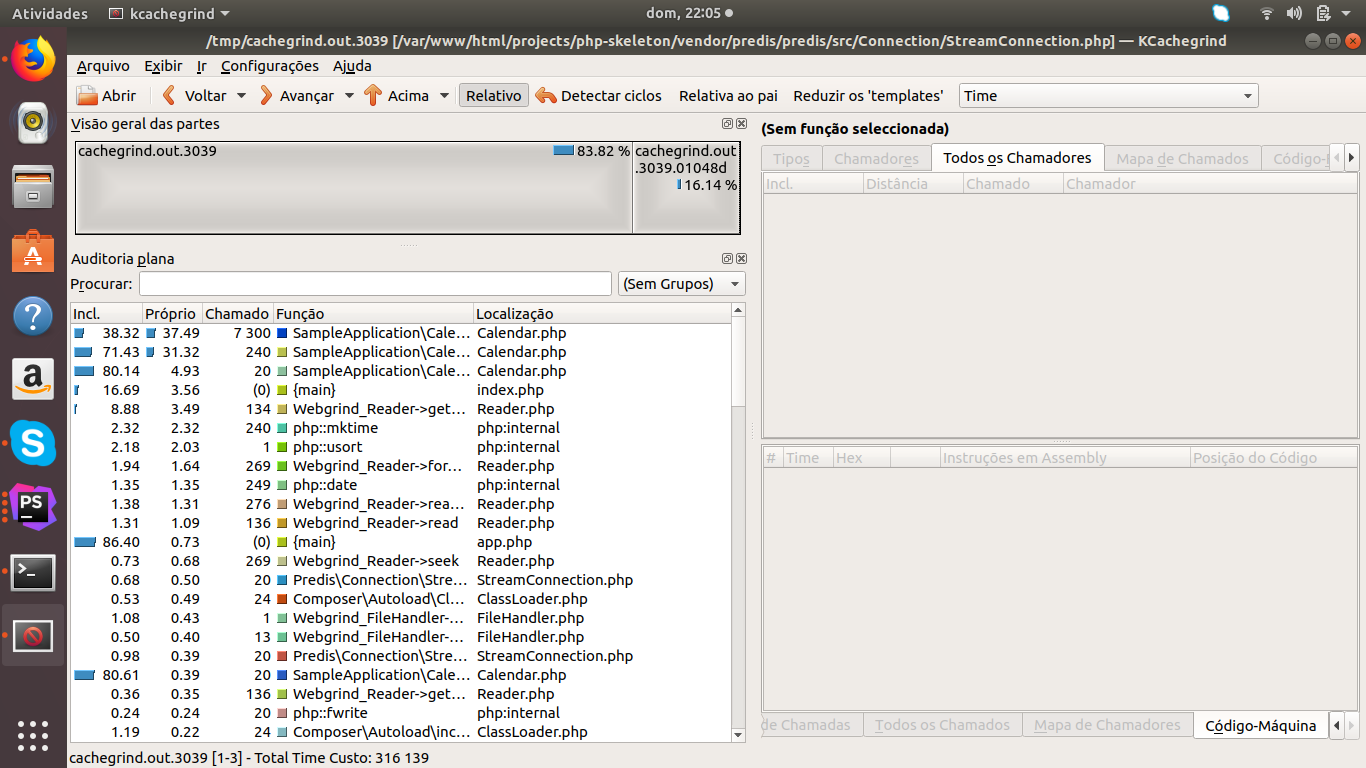
KCacheGrind showing results with a cache layer
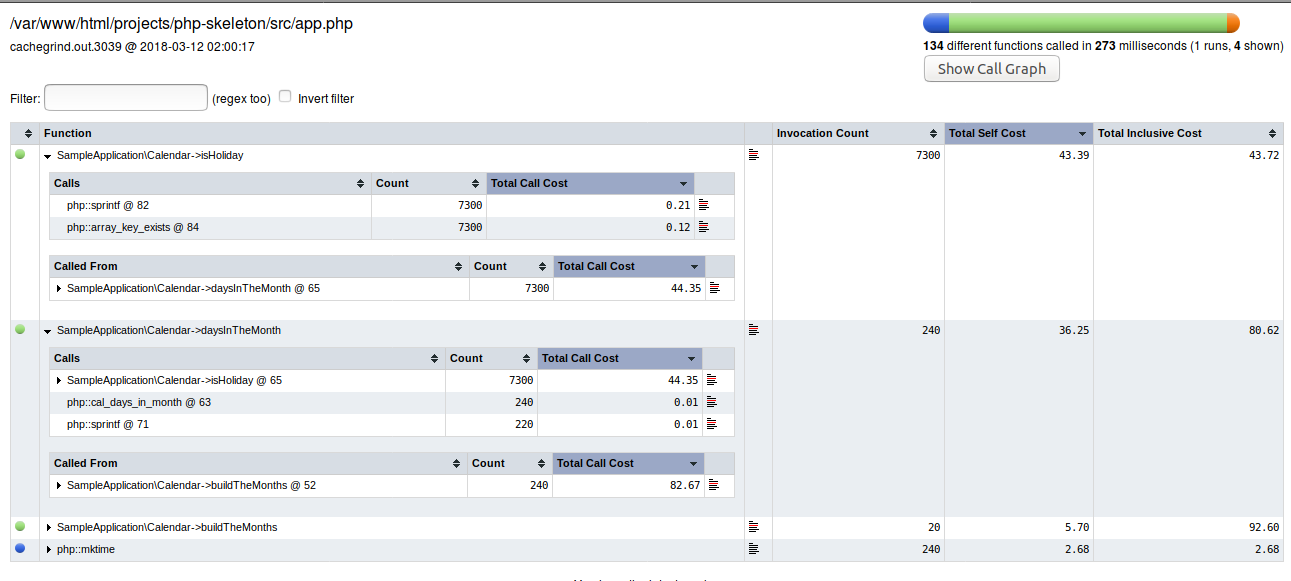
Webgrind dashboard showing the application with tunning
Webgrind chart
Conclusion
With this new approach the execution time amount has decreased from 13 seconds to 0.316 seconds, unquestionably faster. There are still a few things that we could change to improve our application, but it is essential to know what’s the expected outcome mainly in real applications, it easier to get paranoic and trying to improve application beyond the necessary, and sometimes the trade-off is not worth.
My focus in this article it was to show how we can identify possible bottlenecks using tools allowing us to decide where to optimise.